
Deterministic static analysis of COBOL, TAL, C/C++ and SCOBOL — mapping every call path, every file access, every field reference, every dependency. The same source always produces the same answer.
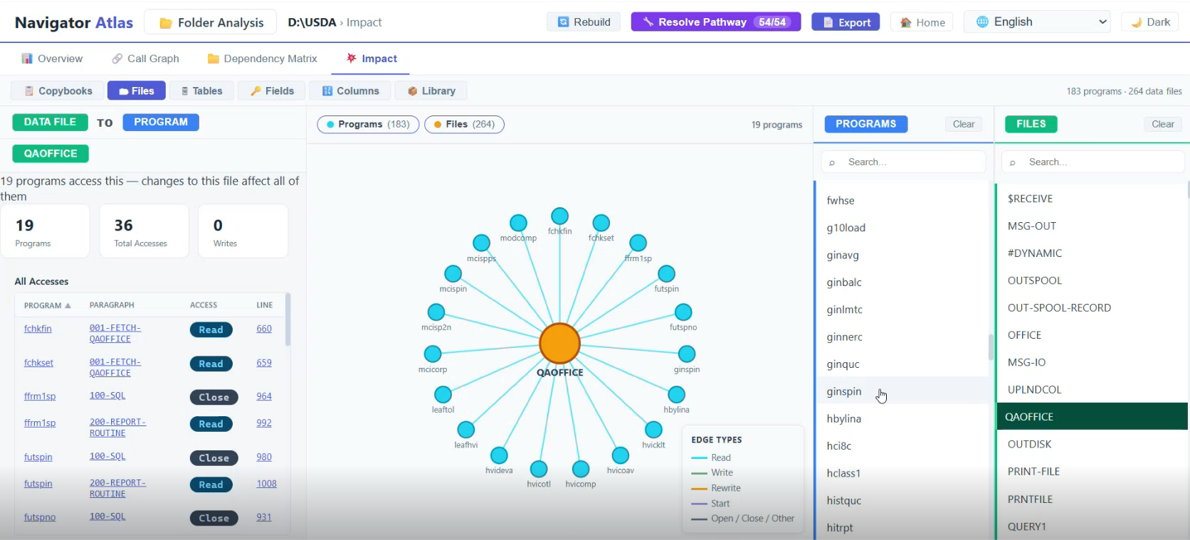
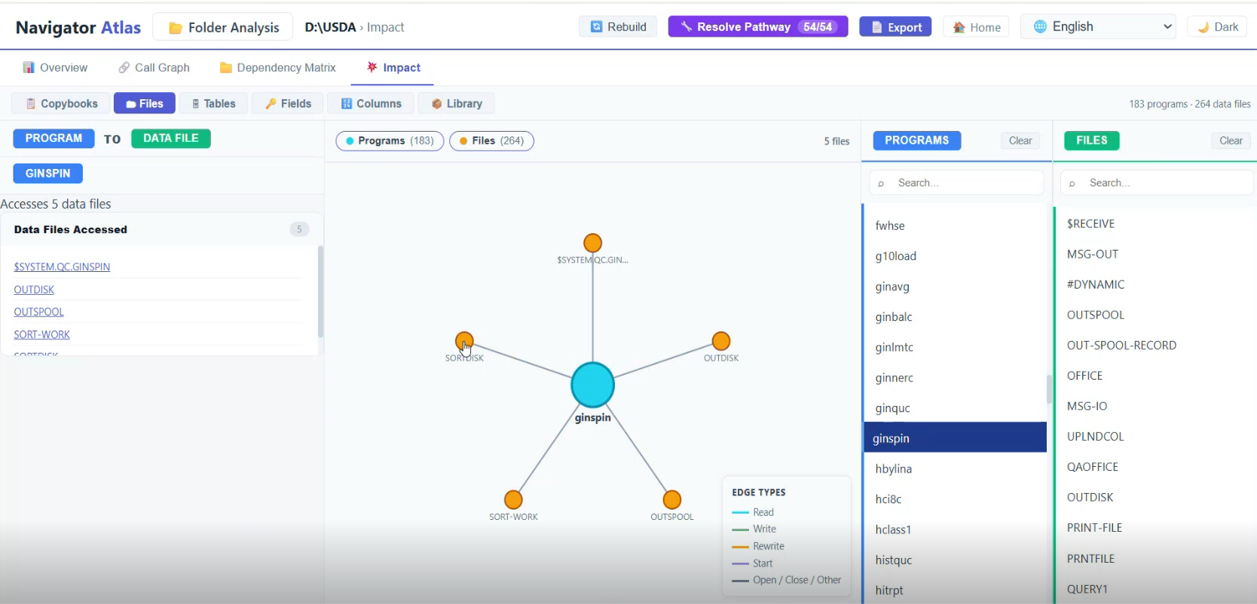
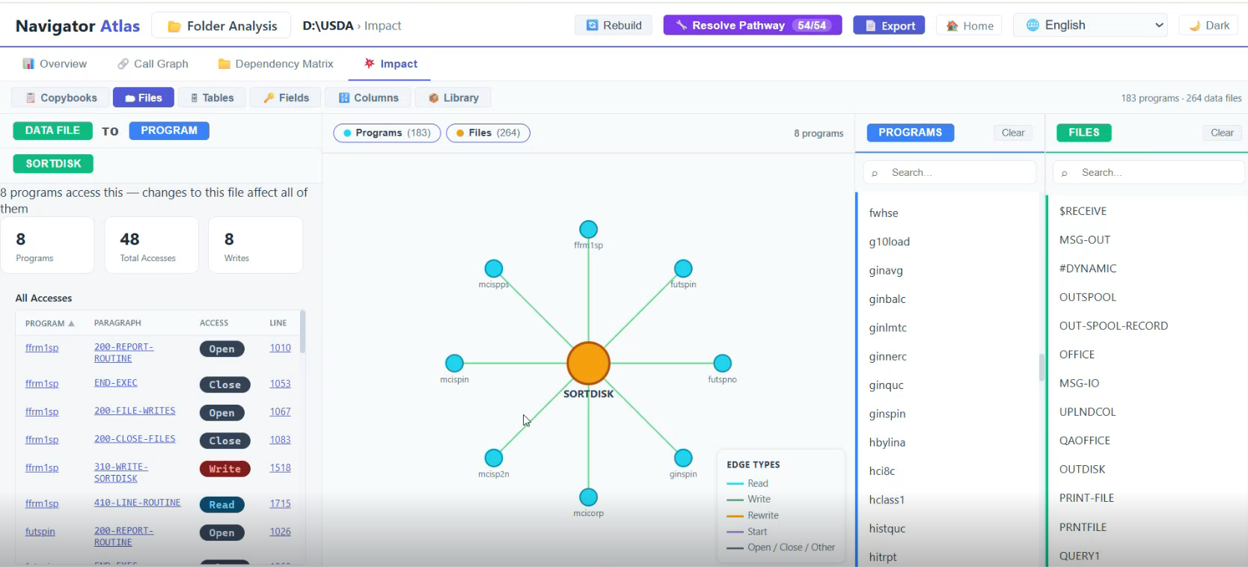
Atlas gives a complete impact picture in seconds — no guessing, no hallucinations.
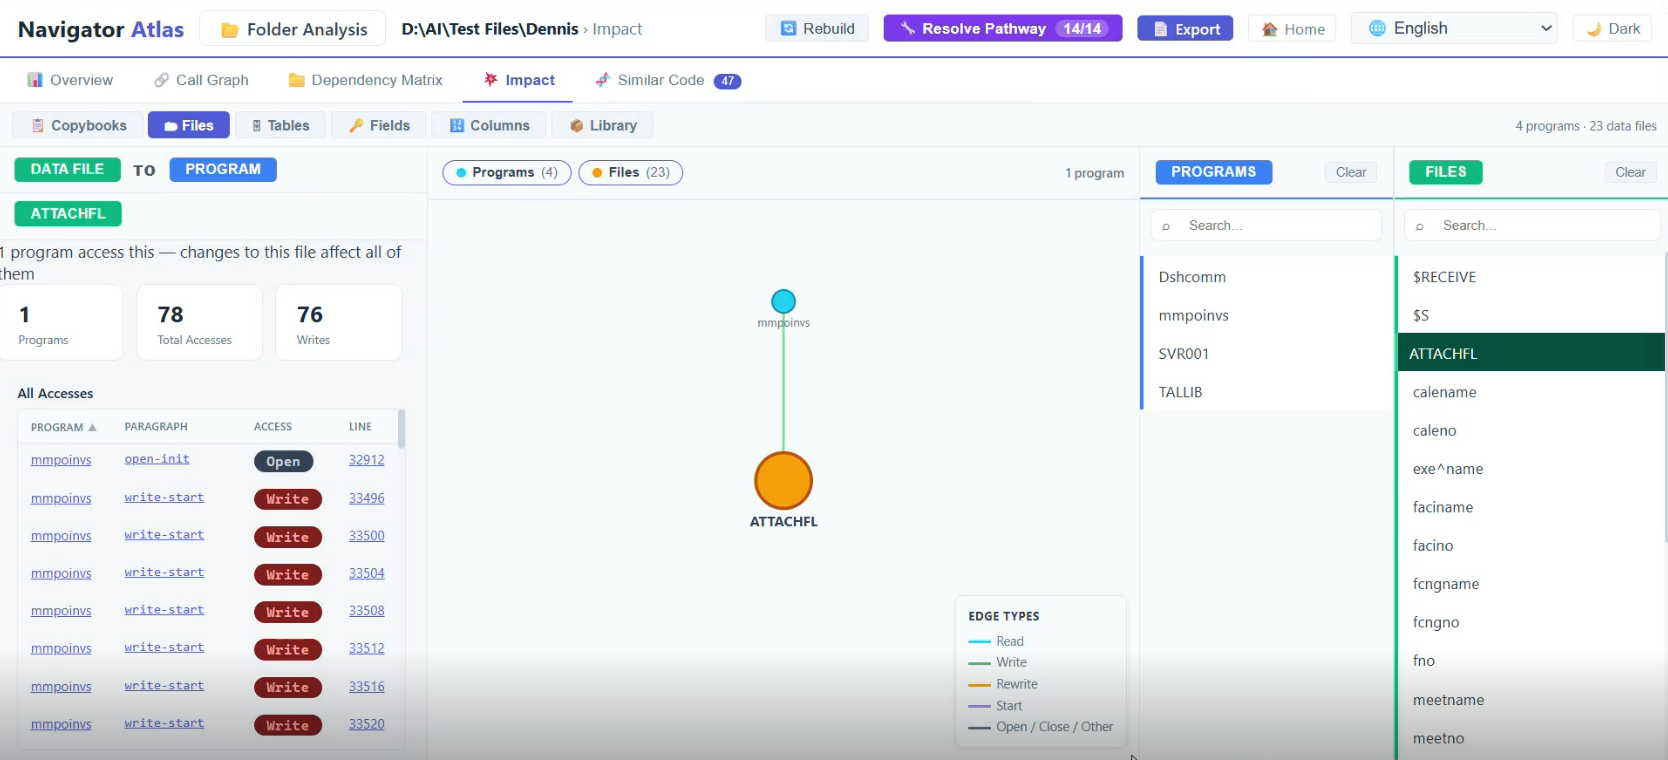
A modified program can break callers that were never documented anywhere.
A changed file layout can quietly corrupt data right across the system.
A renamed field can ripple through copybooks, paragraphs, and data flows that haven't been documented in years.
Atlas performs deterministic static analysis of COBOL, TAL, C/C++ and SCOBOL — mapping every call path, every file access, every field reference, every dependency. Atlas gives a complete impact picture in seconds. The same source always produces the same answer. No guessing. No hallucinations.
The CrossRef Matrix gives you a single grid showing every program's relationship with every file in the folder — the kind of view that used to take weeks of manual documentation to produce.
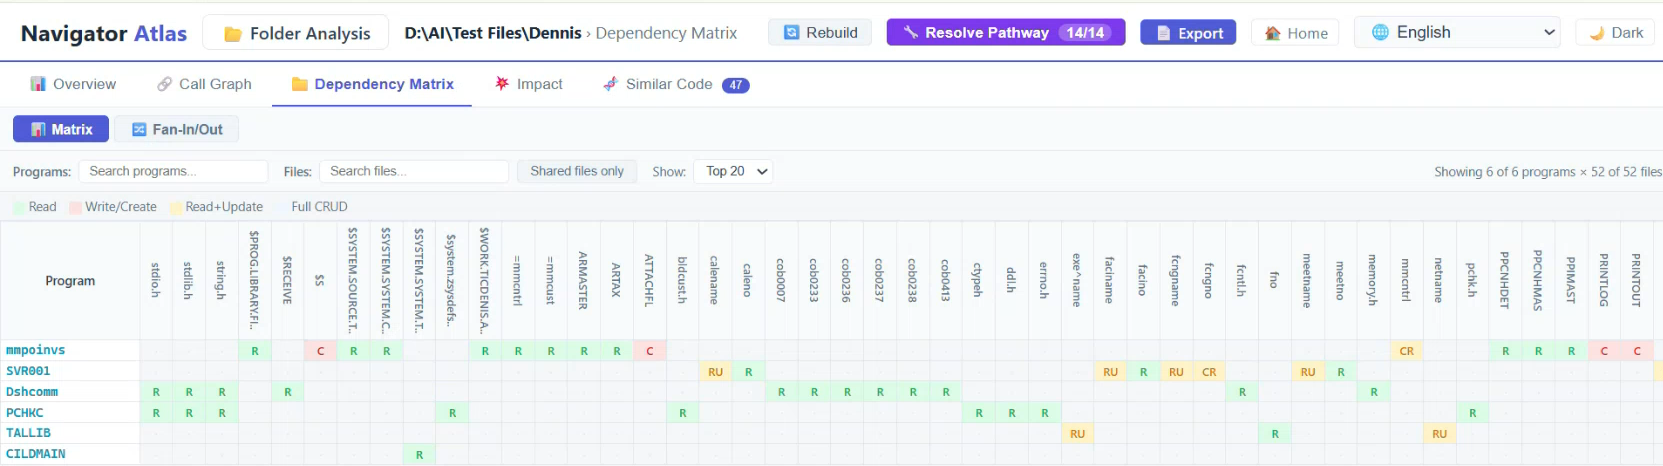
Click any cell in the matrix to navigate directly to that program's detailed file access report. Filter the grid by program name, file name, or shared-file-only to focus on what matters for your current task.
The folder-level Call Graph lifts the view from individual programs to the entire subsystem — showing how programs call each other, where clusters form, and where orphans hide.
Nodes are coloured by subsystem or category, making architectural boundaries immediately visible — even in a folder of 500 programs.
Click any node in the graph to navigate directly to that program's individual report, bridging the folder and program views.
Edges are typed by call mechanism: CALL, ENTER TAL, SEND, and other inter-program communication patterns — each rendered distinctly.
Unreachable programs and tightly-coupled clusters surface immediately — both are key risk signals for modernization planning.
Every program analyzed by Atlas gets a dedicated Report page — a single-screen summary that answers the most common questions without any digging.
Auto-detected language with a manual override badge. Exact line count, including copybook expansion.
Total paragraph count and cyclomatic complexity score — your first signal of maintenance risk.
Dead code, unreachable paragraphs, and structural anomalies surfaced automatically.
Atlas generates six distinct diagram types, all interactive in the browser and exportable as SVG for documentation or architecture reviews.
Paragraph-to-paragraph execution edges — see exactly who calls what.
Control flow at the paragraph level — visualize branching and looping.
Execution sequence and inter-program message flows rendered clearly.
Paragraphs and the files they read or write — map data flow at a glance.
COBOL data structure overlays — understand REDEFINES chains without guessing.
Copybook inclusion hierarchy and complexity heatmap for risk-at-a-glance.
Atlas's deterministic dependency map grounds Navigator's AI explanations, and both can surface in VS Code as developers work.
AI documentation and business rules extracted from your Nonstop source.
Explore Navigator →TAL and COBOL editing, remote compile and AI chat in a modern IDE.
Explore VS Code →Opens that knowledge to AI assistants and the platforms your teams already use.
Explore Nexus →Ready to know the impact?
See Atlas in action.
Get a personalized demo tailored to your Nonstop environment.